Description
Ultimate solution for rich graphs
and dashboards fully integrated with Zenoss 5.
Integrated the latest Grafana v2.5.0:
-
Rich graphing
Your managers will love this feature. Fast and flexible client side graphs with a multitude of options.
-
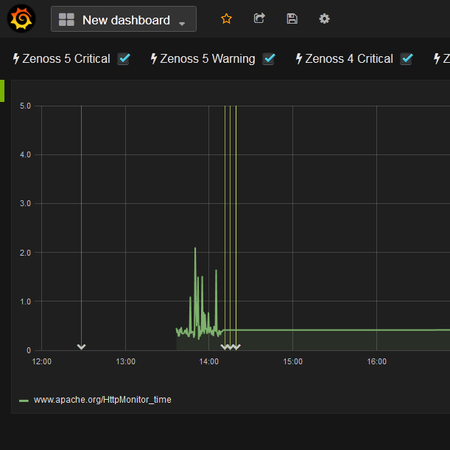
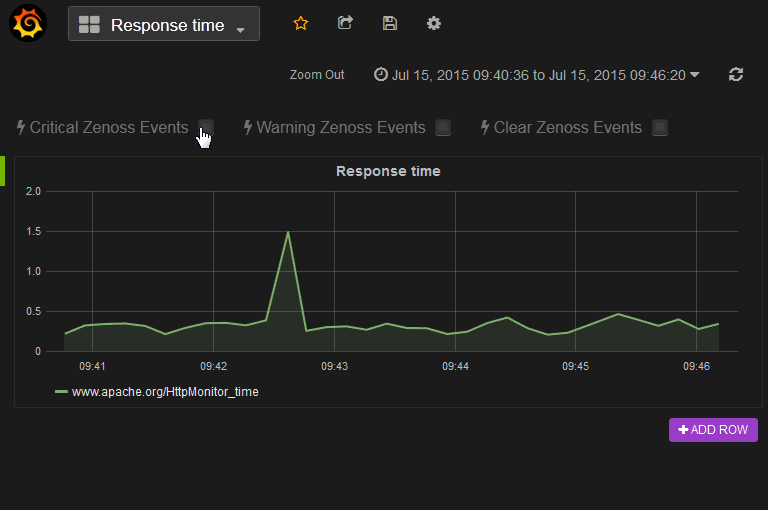
Zenoss events in graphs
Create annotations from Zenoss events – you will be able to find any correlation much easier.
-
Dashboards
Drag and drop panels, change row and panel width easily. Build your specialized and customized dashboards for teams and members.
-
Deployment via Control Center
Command line is not required anymore. Easy and simple deployment.
-
Zero configuration
Autoconfiguration detects and prepares everything, what is required. No configuration action is required, if standard Zenoss config is used.
-
Zenoss 5 authentication
Use your Zenoss 5 account for authentication. No external authentication service. Standard Grafana methods (local, Github/Google OAuth) are still available in the config.
-
Persistent storage
You can redeploy/restart Grafana container and you have still your original configuration. Useful for further upgrades.
-
Monitoring of Grafana logs
Fully integrated Logstash. Detect any Grafana issues in Control Center.
-
Multiple data sources
Additional Zabbix data source is available. And built in datasources as well: Graphite, Cloudwatch, Prometheus, InfluxDB, OpenTSDB, KairosDB, Elasticsearch, SQL.
What is included in product Grafana 2 for Zenoss 5 Core:
- > Control Center json template
- > 3 month access to the private Docker image on official Docker Hub
- > First installation support
- > perpetual license
Are you user of Zenoss 5 Service Dynamics (commercial Zenoss 5 version)?
Contact us for custom enterprise annual subscription.